Steps for threshold determination
The tool follows an assumption that the data is accurate and has very low missing information but practically, the data may contain erroneous values, outliers, high missing values, poor quality imputation and sequencing error. Therefore, the threshold determined here may not be universal and may vary a little with very high or very low number of markers, type of crop, extent of heterozygosity in the crop, quality and quantity of the data, sequencing error etc. Thus, we recommend before applying the tool for a large dataset with high number of genotypes, the tool may be calibrated with a small set having known duplicates with all markers. The following steps may be follwed to determine the threshold genotypic difference from a smaller dataset with known duplicates.
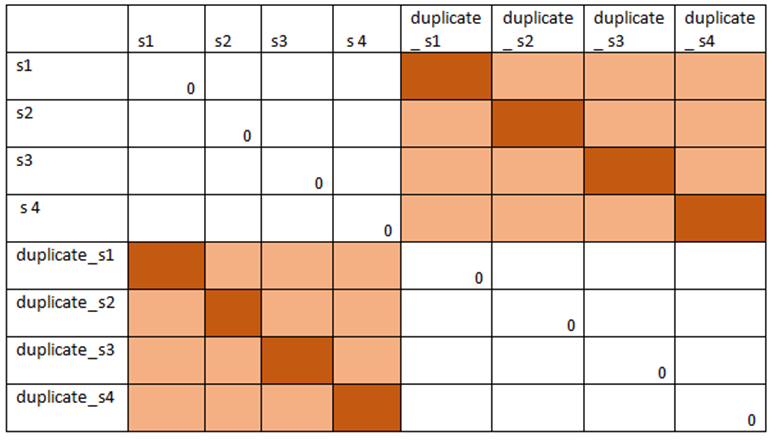
Step 1. Arrange the duplicate genotypes in the same order as the original genotypes in the hapmap file as shown below:
 Note: kindly keep the number of markers same as the original large dataset.
Step 2. Upload the hapmap file to the GDIRT online or offline with appropriate set of parameters and select the type of genotypic difference whose threshold you want to determine.
Step 3. From the result download the difference matrix.
Step 4. Extract the sub matrix from either upper or lower diagonal that gives pairwise difference between original and duplicate genotypes.

Step 5.Extract the diagonal values of any of the sub matrix
Step 6. Plot the diagonal values using plot command of R-software interface.
Step 7. Determine the range of diagonal values after discarding the outliers (might be arisen due to missing data).

Step 8. Select at least five threshold values within that range at equal interval and find out the number of true positives, true negatives, false positives and false negatives.
Step 9. Calculate sensitivity (Sn), specificity (Sp), accuracy (Acc), positive predictive value (PPV) and Mathew’s Correlation coefficient t(MCC) using the following formulas.
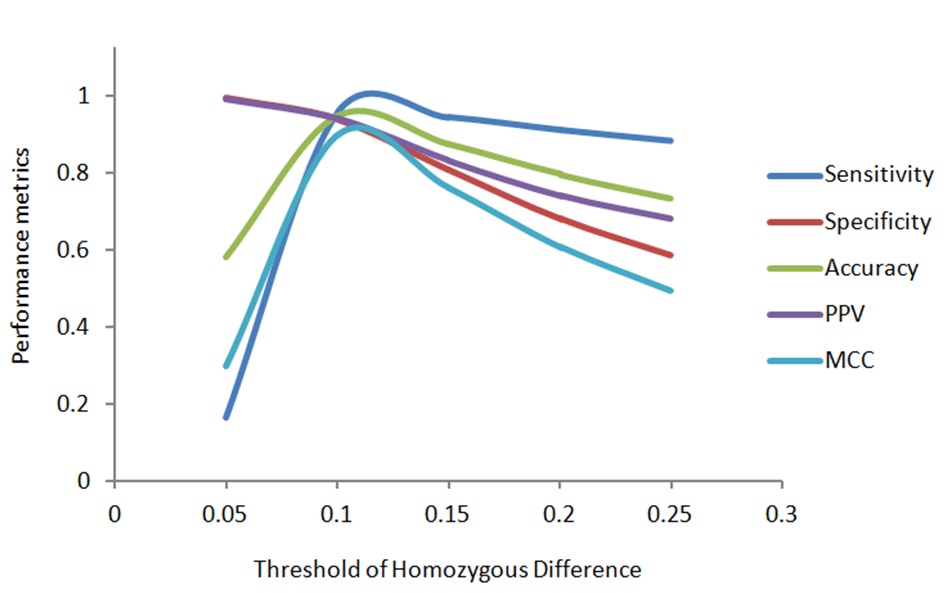
Step 10. Plot the performance metrics and find out the threshold where all the performance metrics highest and balanced.

Step 11. Use the threshold to identify duplicates from the large dataset.